How to use Metrics
Metrics is a feature that shows summary statistics for your columns in the footer of the list table. This gives you quick insight into your data, like the average price of your products, the number of empty fields, or the earliest published date.
Metrics are calculated across all pages of the list table, not just the items on the current page. When you filter or search, the metrics are based on the filtered results.

How to enable Metrics for a column
You can enable Metrics per column on the column settings page.
- Go to the column settings page and find the column you want to show a metric for.
- Click the Metrics icon (Σ) to enable it.

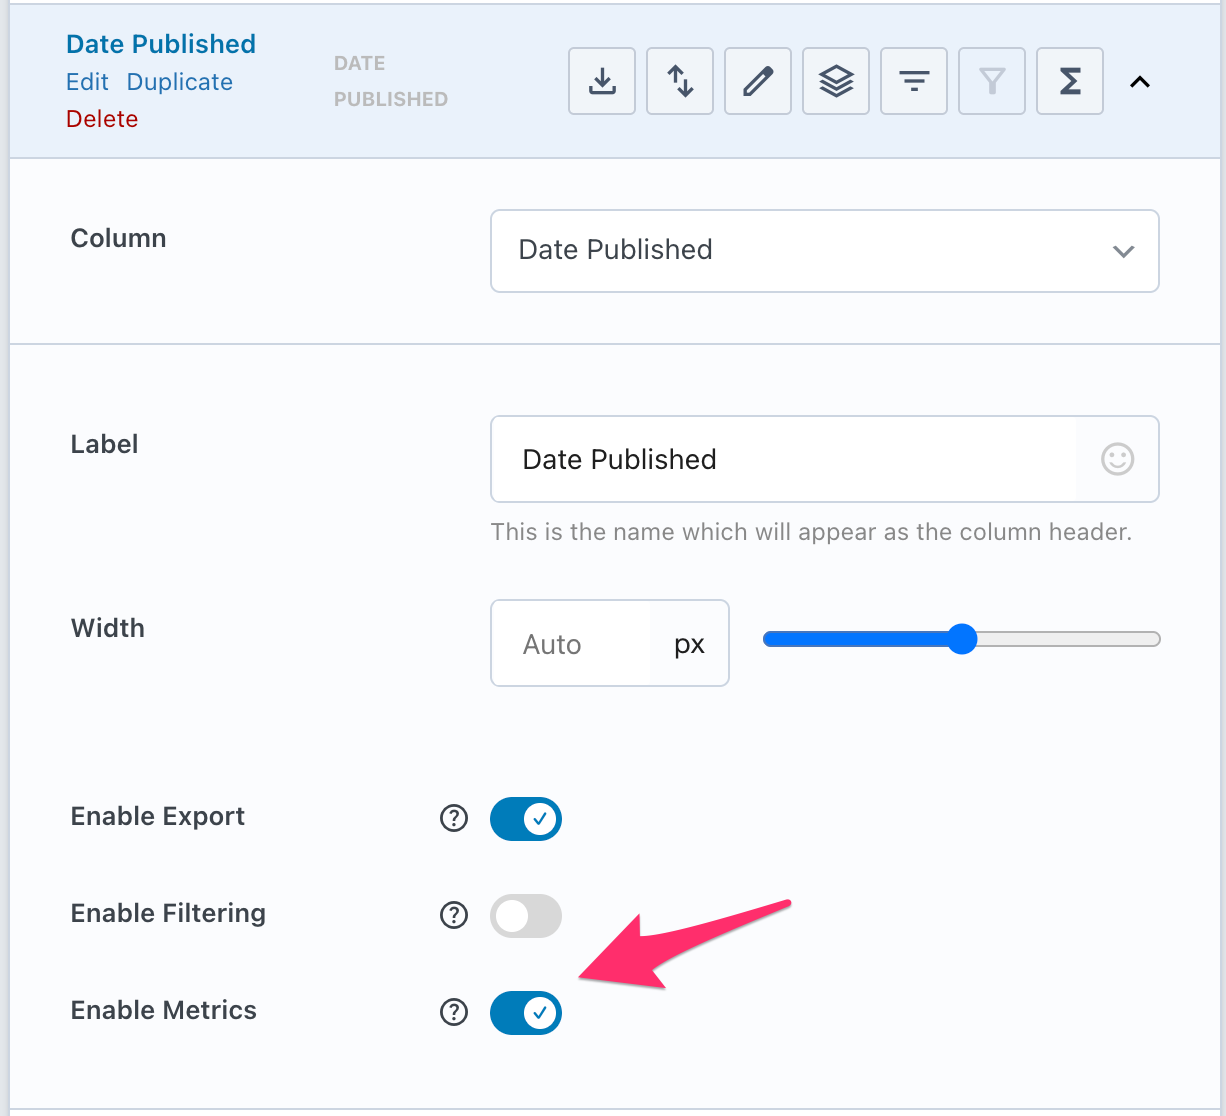
- You can also enable Metrics by opening the column settings and using the Metrics toggle. Both toggles work side by side.
- Click Save Changes. The metric now appears in the footer of the list table


On the list table you can switch between the available metrics by clicking the metric button in the footer of that column.
How to change the metric on the list table
You can change which metric is displayed directly on the list table, without going back to the settings page.
- Click the metric button in the footer of the column.
- Select one of the available metrics from the menu.
- The footer immediately shows the new metric. Your choice is saved as a user preference.

Available metric types
The available metrics depend on the type of data in the column. We have support for multiple data types:
Text
For text-based columns you can display:
- Empty: the number of items without a value
- Not empty: the number of items with a value
- Percentage: the share of empty or filled values
This is useful for spotting incomplete content. For example, Empty 3.64% on a Description column tells you that some items are still missing a description.

The Empty and Not empty metrics are not limited to text columns. They are available for almost every column type, including the types below, so you can also use them on, for example, an image or date column.
Numeric
For columns with numeric values, you can display:
- Average: the average value
- Minimum: the lowest value
- Maximum: the highest value
- Range: the difference between the lowest and highest value
- Total: the sum of alle the values
For example, on a Price column the metric Minimum 650 shows the cheapest item in your list.

Date
For date columns, you can display:
- Earliest: the oldest date
- Latest: the most recent date
- Range: the time span between the earliest and latest date
For example, Earliest February 19, 2026 on a Date Published column shows the oldest publication in your list.

Select
For columns based on a fixed set of options, such as a select custom field, you can display the count or percentage per option. For example, a Fuel Type column can show Petrol 46 , the number of cars that run on petrol.

How to use Sticky Metrics
By default, the metrics row is part of the table footer, so it scrolls out of view on long tables. With Sticky Metrics the metrics row sticks to the bottom of the screen while scrolling, so your statistics stay visible.
To enable Sticky Metrics, click the pin icon on the left side of the metrics row in the table footer. Click it again to unpin.

Sticky Metrics works well together with Sticky Headers, which keeps the column headers visible while scrolling.